Understanding Global Temperature Change
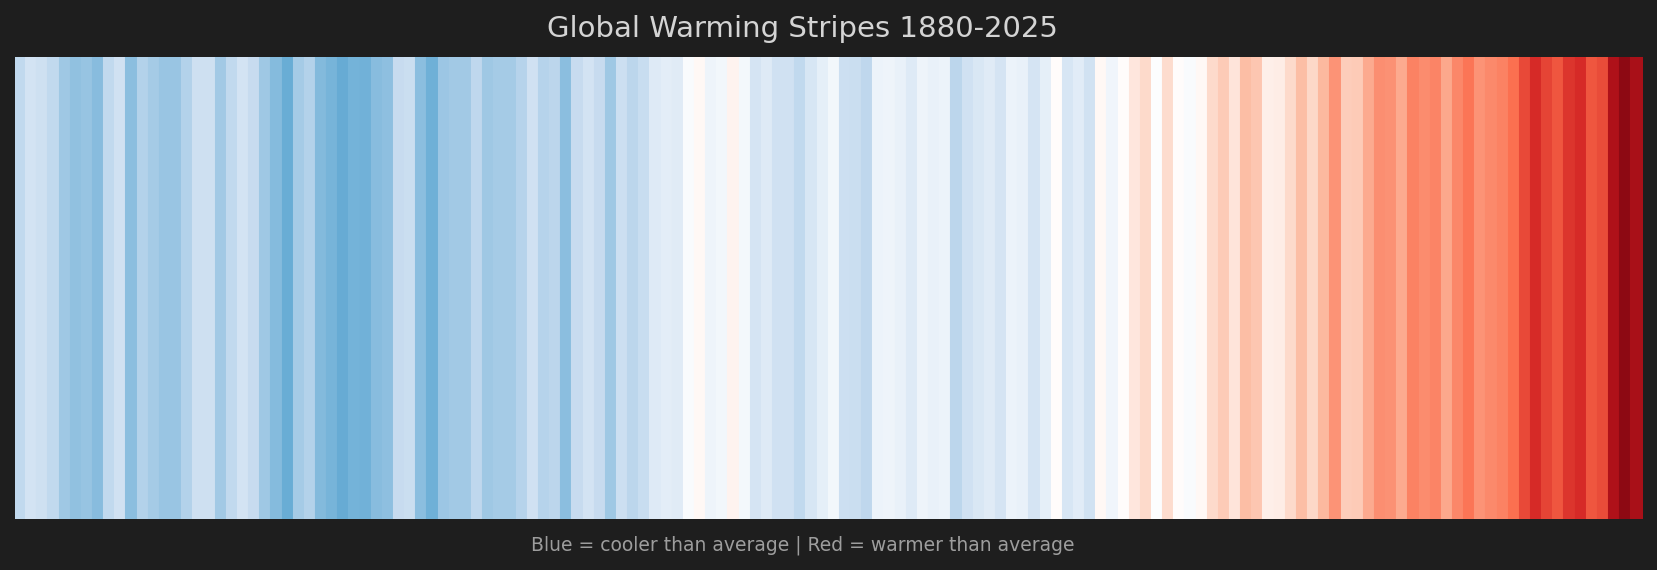
Earth's global average surface temperature has increased by approximately 1.3°C (2.3°F) since the late 19th century, with most of the warming occurring in the past 50 years. The rate of warming has accelerated dramatically: the planet is now warming at roughly 0.2°C per decade.
Key Finding: The 10 warmest years in the instrumental record (since 1880) have all occurred since 2010. The year 2024 set a new record at +1.38°C above the pre-industrial baseline.
What's Driving the Warming?
The primary driver is the increase in atmospheric greenhouse gases, particularly carbon dioxide (CO2) from burning fossil fuels. CO2 levels have risen from ~280 ppm before the Industrial Revolution to over 424 ppm today - a 52% increase. This is higher than at any point in at least the past 800,000 years.
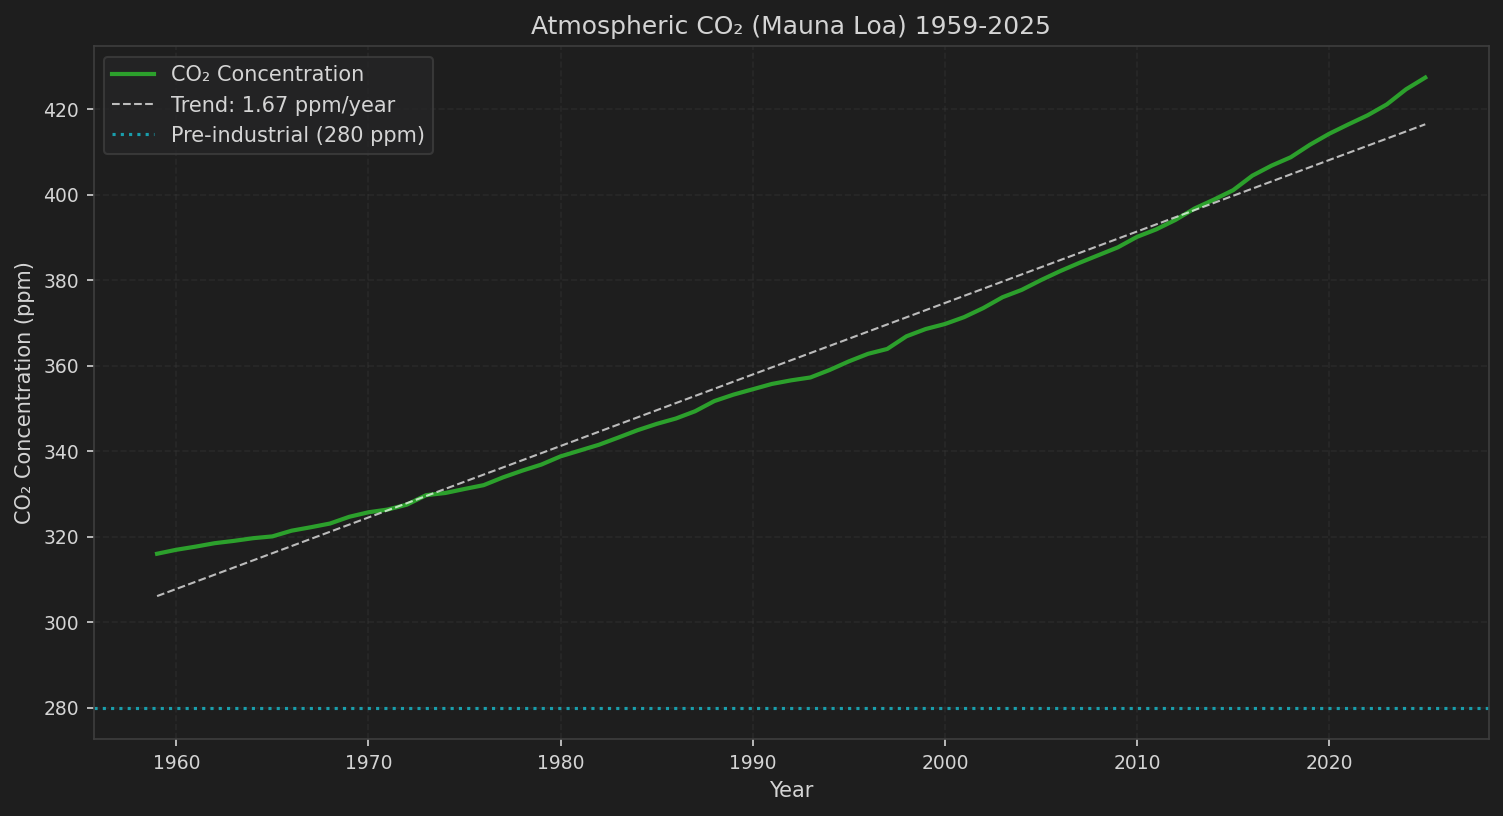
The Keeling Curve, named after scientist Charles David Keeling who began measurements in 1958, shows the relentless rise of atmospheric CO2. The sawtooth pattern reflects seasonal variation (plants absorb CO2 in summer), but the underlying trend is unmistakable: CO2 is increasing at approximately 2.5 ppm per year, and the rate is accelerating.
CO2 Context: At 424 ppm, current CO2 levels are higher than at any point in human history. Ice core records show CO2 has not exceeded 300 ppm in at least 800,000 years. We have increased atmospheric CO2 by 52% in just 170 years.
Addressing Climate Myths
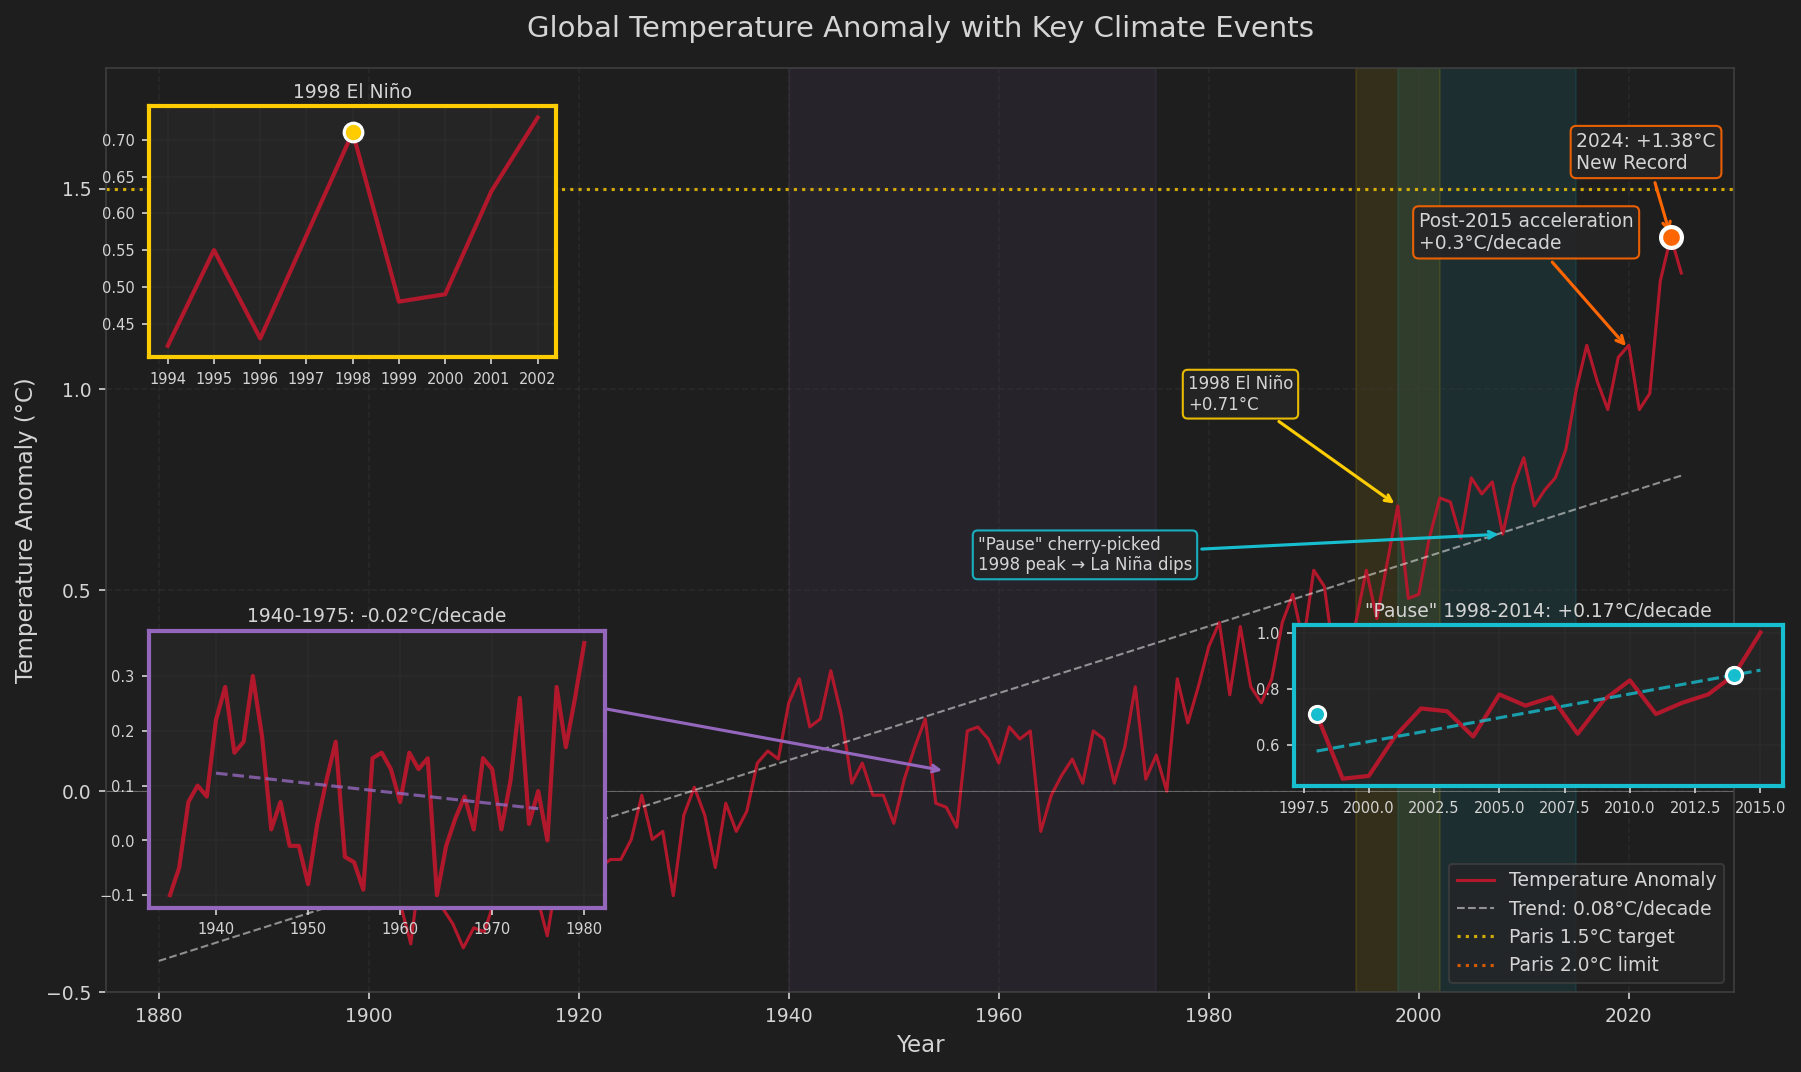
Two persistent climate myths are addressed in the annotated chart below:
- "1970s Global Cooling": From 1940-1975, temperatures showed a slight cooling trend (-0.02°C/decade). This was real, but caused by aerosol pollution (sulfates) from industrialization masking greenhouse warming. Crucially, even then the scientific literature showed 44 papers predicting warming versus only 7 on cooling. There was never a scientific consensus for cooling - just a few sensationalized media articles.
- "Global Warming Pause": In the late 2000s, skeptics claimed warming had "paused" since 1998. This cherry-picked the 1998 El Niño (an unusually warm year) as a starting point. Even during 1998-2014, warming continued at +0.17°C per decade.
Observed Impacts
- Sea Level Rise: Global mean sea level has risen ~100mm since 1993, currently rising at 3.4 mm/year
- Arctic Amplification: The Arctic is warming 2-3x faster than the global average
- September Arctic Ice: Declined from ~7.5 million km² (1980s) to ~4.2 million km² today
- Ocean Heat: The ocean has absorbed over 90% of excess heat, with content increasing dramatically since 1990
Paris Agreement Context
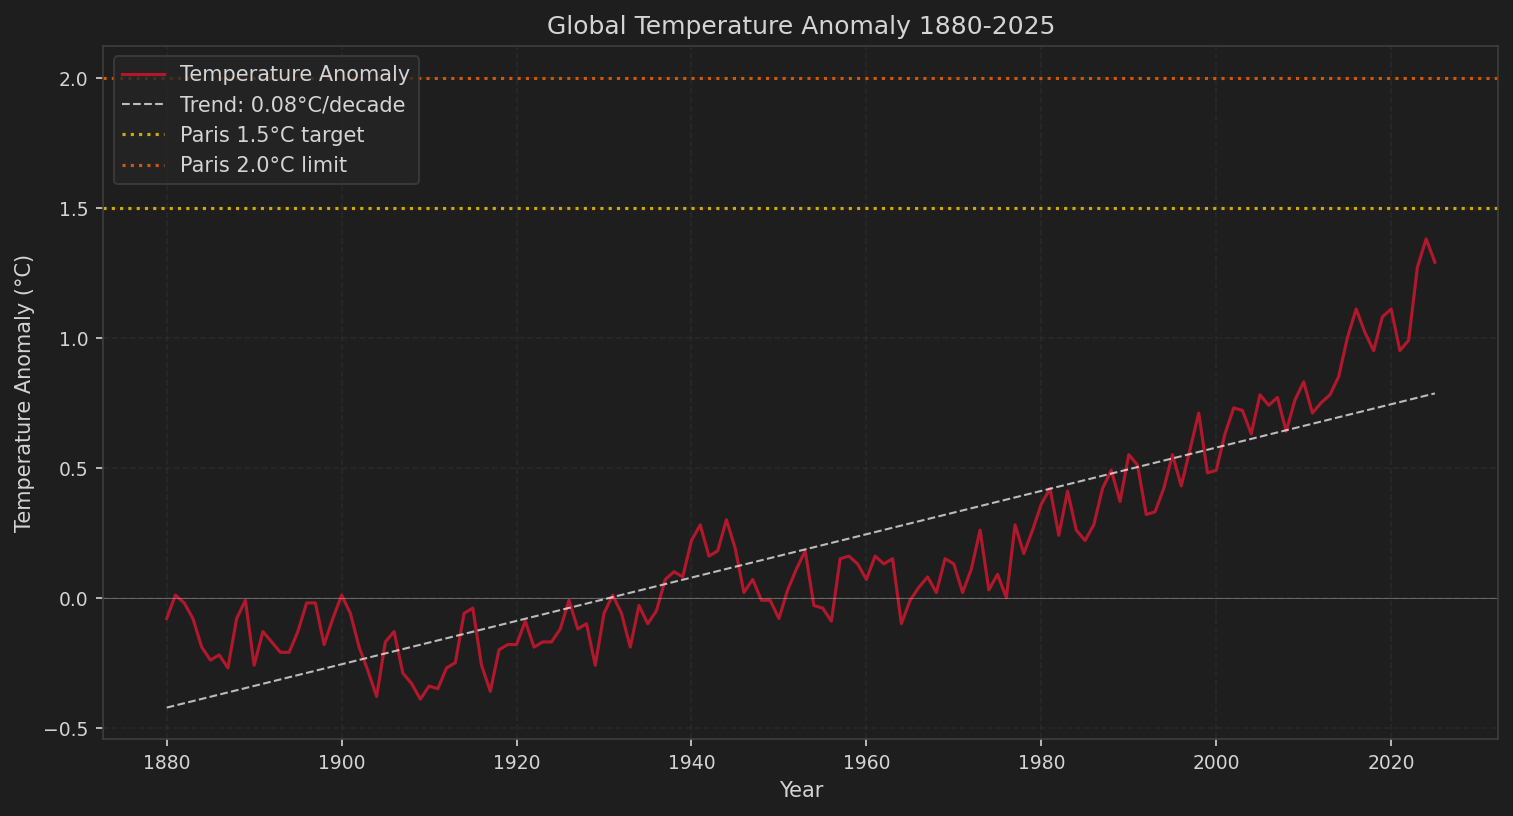
The Paris Agreement aims to limit warming to 1.5°C above pre-industrial levels, with 2.0°C as an upper bound. At the current rate of warming (~0.2°C/decade), the 1.5°C threshold could be crossed in the 2030s.
Current Status: At +1.38°C (2024), we are already 92% of the way to the 1.5°C Paris target. Without significant emissions reductions, this threshold will likely be crossed within the next decade.
Data Sources
This domain integrates data from authoritative scientific sources:
- Temperature: NASA GISTEMP v4 (1880-present)
- CO2: NOAA Mauna Loa Observatory (1958-present)
- Methane: NOAA Global Monitoring Laboratory (1983-present)
- Sea Level: NOAA Laboratory for Satellite Altimetry (1992-present)
- Arctic Ice: NSIDC Sea Ice Index (1979-present)
- Ocean Heat: NOAA NCEI (1955-present for 0-700m)
- Emissions: Our World in Data / Global Carbon Project (1750-present)
See the Data Sources page for complete documentation, and Visualizations for the full chart gallery.